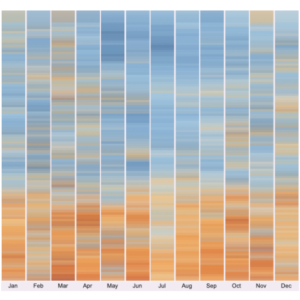
A historic temperature visualization developed by Arizona State University’s Knowledge Exchange for Resilience is a tool that shows shifts in temperatures using an interactive heat map and bar graph. It includes historical Arizona temperatures from the 1890s to the present.
“The raw data from the Arizona State Climate Office features 130,000 traces of daily temperature data spanning across three cities over 130 years. It was challenging to transform such an extensive data set into a useful visualization,” said the lead scientist for the tool, Assistant Research Professor Sarbeswar Praharaj, PhD with the Knowledge Exchange for Resilience.
The warm and cool color palette highlights the degree of temperature changes from the baseline number. The data is organized by month, which shows changes over a calendar year and allows users to travel back several decades or just to last summer.